SAP Analytics Hub — AstraZeneca
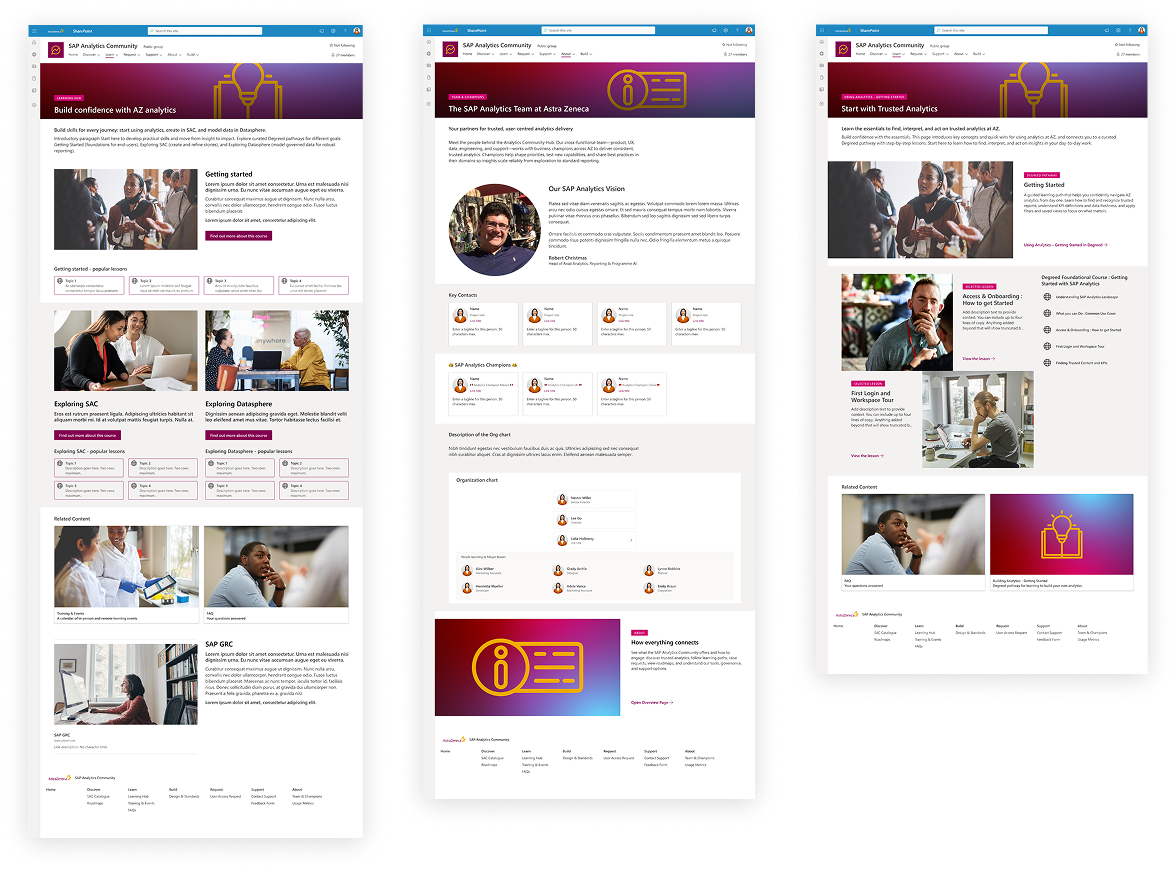
Building a central onboarding and support hub for a global, simultaneous rollout of SAP Analytics Cloud — from IA and sitemaps through to user testing, a formal executive readout, and a prioritised set of recommendations that made it into the product.
The Problem
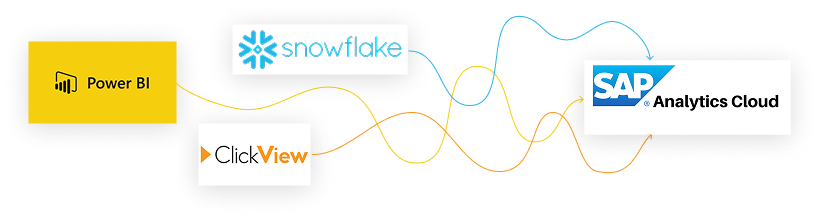
AstraZeneca was migrating its entire global analytics operation onto SAP Analytics Cloud at once — not a phased rollout, but a business-wide switch away from a fragmented landscape of tools, each with its own naming habits, folder structures, and working conventions. Because the move was simultaneous across the organisation, there was no existing pocket of in-house SAC expertise to lean on. Whatever support and onboarding infrastructure was needed had to be built from scratch, for everyone, at the same time.
Without a shared front door, support and training questions scattered across teams with no consistent way to find the right help depending on where someone sat on the experience spectrum. Some users had never touched an SAP product; others were experienced with different SAP tools but new to SAC specifically; others were quickly gaining confidence and looking to build their own dashboards. Add to this an imminent system launch deadline and a complex stakeholder network spanning multiple teams with their own priorities and sign-off requirements, and the brief was clear: design something navigable and buildable under real time pressure.
My Role
I was the sole UX resource for the initial phase of this project, working within a small client design and delivery team. I owned the information architecture, sitemaps, wireframes, and navigation scheme end to end, and conducted all of the user research interviews and usability testing on early prototypes, writing up findings and recommendations as a formal executive readout for stakeholders. A second UX designer joined later to help build out subsequent page designs once the initial screens and approach were established and validated.
The Approach
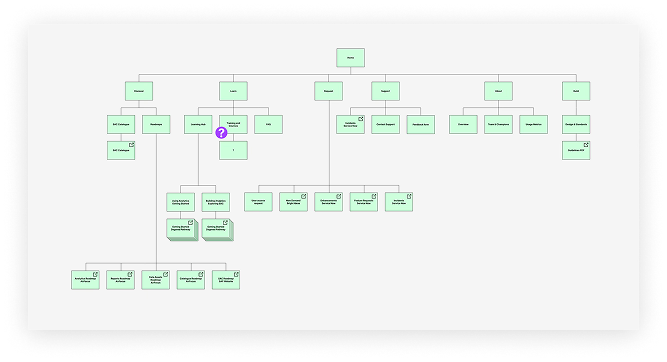
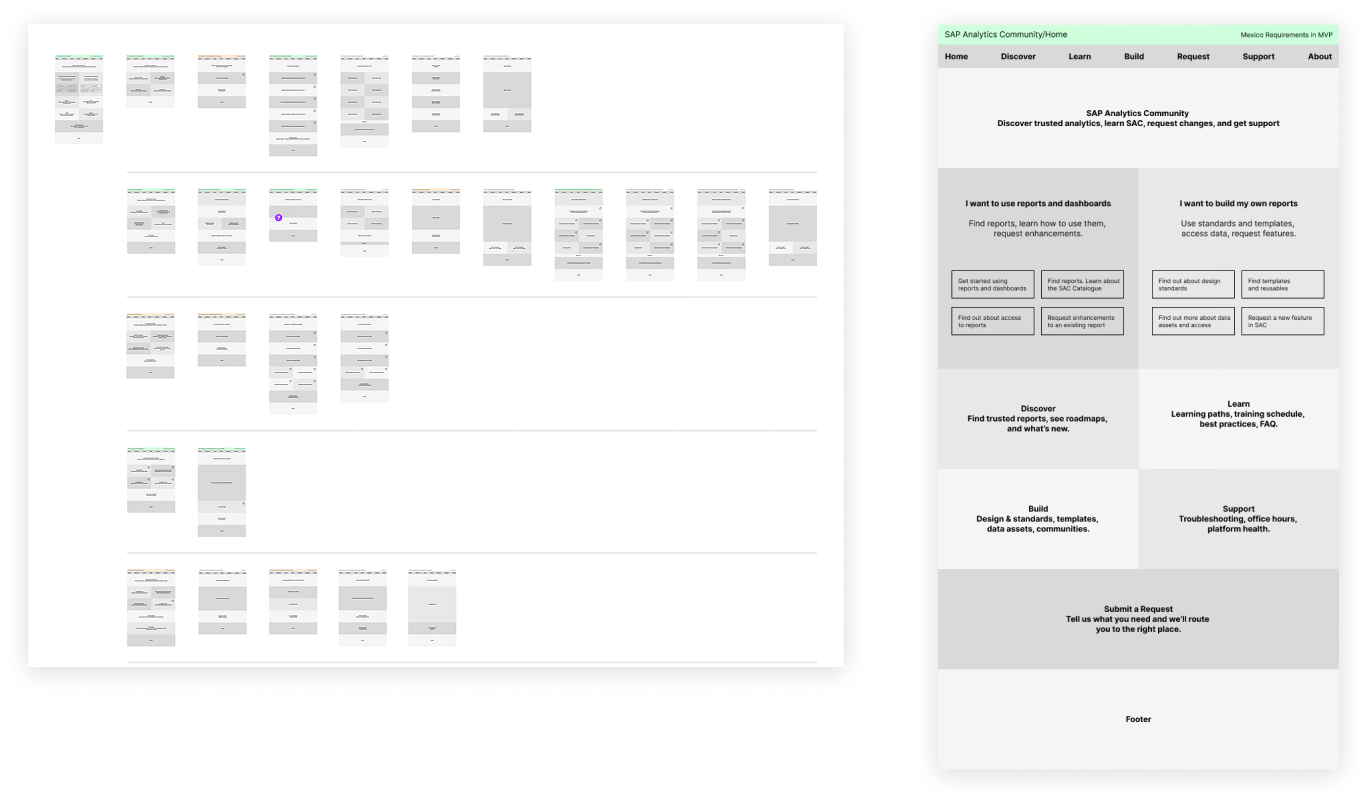
Five existing AstraZeneca analytics personas shaped the IA from the outset, covering a range from passive report consumers through to data scientists and governance stewards. Rather than designing a single generic experience, I used these personas to define what each group actually needed from the hub, which drove a six-pillar structure (Discover, Learn, Request, Support, About, Build) and a homepage built around two clear entry paths — "I want to use reports and dashboards" and "I want to build my own reports" — so users could self-select immediately rather than hunting.
The process moved through sitemap and IA, then low-fidelity wireframes across the full site, then a clickable prototype used for moderated usability testing. On the platform question, the build team's instinct was to go custom. I pushed instead for working within SharePoint's out-of-the-box functionality — a position I researched thoroughly and had to argue for — because it reduced build complexity significantly without constraining the design. The project was also scoped in phases: an MVP for the immediate launch, with a Phase 2 linking out to existing tools like Airfocus and ServiceNow rather than rebuilding functionality that already existed elsewhere.
Key Findings
Testing across four sessions, covering end users, makers, and analysts, found that the navigation itself held up well — participants correctly reached Support, Request, Learn, and Build without difficulty. The friction sat one level down, in terminology and process. Key internal terms didn't mean what users assumed, and handoff points to external tools like Jira and ServiceNow became drop-off points when there wasn't enough guidance or pre-populated context to carry users through.
I wrote these findings up as a formal executive readout, prioritising near-term fixes — pre-populated request intake, step-by-step guides for external tool handoffs — alongside medium-term work on terminology and trust signals. The readout also included a re-test plan rather than treating testing as a one-off exercise.
The Outcome
The hub shipped and went live for users. Several of the near-term recommendations were subsequently actioned, including the structured request intake and clearer external tool guidance. I don't have formal adoption metrics for this phase, but the clearest signal of success is that the research-to-roadmap loop closed: evidence-based recommendations made it into the product rather than sitting in a deck.